Changing Enrolments by Year and Grade
The changing patterns of enrolment over time in African countries are illustrative of the problems that have hampered attempts to universalise access to basic education, generally taken to consist of eight or nine years of schooling to the end of lower secondary school. Using administrative data from school censuses allows time series of enrolments by grade to be plotted. The results for eight African countries are shown below indicating how enrolments in each Grade over the basic education cycle have changed in different years. Children in a particular grade would normally be expected to be promoted to the next grade the following year. A high enrolment low attrition system would therefore show enrolment lines that were parallel and close together. This is only true in South Africa. It is clear that the evolution of participation has been very different in different countries.
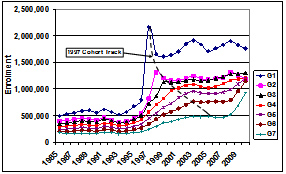
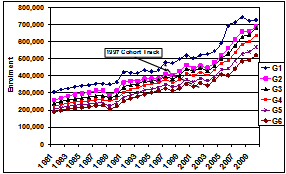
In Uganda Universal Primary Education (UPE) was announced in 1997 and enrolments in Grade 1 more than doubled. However, these Grade 1 children did not arrive in Grade 7 seven years later as the cohort track on the chart shows. The system reached a new equilibrium with high drop out and many overage children. The numbers reaching Grade 7 in 2007 were only about half the number in an age cohort. In the last two years there appears to have been an acceleration of enrolment growth in Grades 6 and 7 as a result of new efforts to meet enrolment targets in advance of 2015. Completion rates remain well below those necessary for EFA to be achieved. Indeed the data shows that there was much “queuing” in Grade 6 as schools kept back children likely to fail the Grade 7 primary school leaving certificate (Lewin, 2007b).
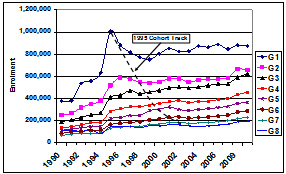
In Malawi a similar patterns is evident with over enrolment in Grade 1 persisting year after year. The proportion of students graduating from Grade 8 has remained fairly similar despite a dramatic increase in total enrolments, and remains about a quarter of those enrolled in Grade 1. Attrition remains alarmingly high (Chimombo, 2009) ad there is no sign it is diminishing.
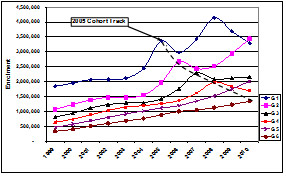
Kenya also has a similar if less extreme pattern of enrolment growth. The most recent announcements of free primary schooling have generated peaks in enrolments in Grade 1 which are not fully translated into peaks in subsequent Grades indicating that not all progress. Grade 8 has at least 20% fewer enrolled than Grade 7 indicating as in Uganda that queuing is taking place in Grade 7 as schools hold back those unlikely to do well in the primary leaving certificate.
In Ethiopia over a ten year period there has been a considerable improvement in the numbers entering Grade 1. A peak in mid decade was followed by a trough that itself was followed by another peak in 2008 reflecting national initiatives. These gains have yet to reach the higher grades but it does appear that more will complete the primary cycle than in the past and that real gains are being made in participation.
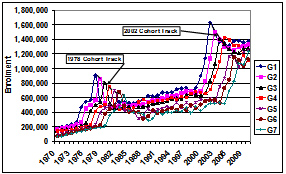
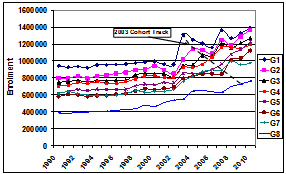
Tanzania has had two attempts at UPE and this is clearly visible in the chart. The last attempt appears more successful than the first when large enrolment gains were followed by a steep fall off in participation in the 1980s (Lewin, 2009, Sabates, et al., 2011b). In Tanzania there were clearly two waves of enrolment growth linked to attempts to universalise primary education. The progress made in the late 1970s after the Arusha declaration stalled in the 1980s. It was revitalised by the 2002 initiative to make primary school free and available to all. Rapidly increasing enrolments in Grade 1 have been reflected in greater enrolments in higher Grades and in a narrowing of the gap between enrolments in Grade 1 and Grade 7.
In Ghana Free Compulsory Basic Education (FCUBE) led to enrolment growth with only a small step upwards in the late 1980s. The gap in enrolments between Grade 1 and Grade 6 has remained fairly constant over 20 years, suggesting drop out and completion rates failed to improve. Fee free schooling linked to capitation payments to schools had an impact on enrolments in 2005. This appears to be a one off gain in total enrolments which is being sustained. However it does not appear to have had much effect on attrition (Akyeampong, 2011). In Zambia enrolment growth in Grade 1 has stabilised since 2007 after a period of growth linked to the most recent announcements on free primary schooling. Grade 7 enrolments remain about 60% of those in Grade 1.
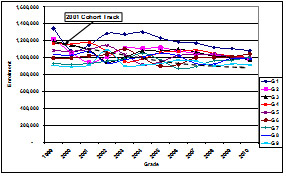
South Africa has a different pattern. Since 2000 it has had high levels of enrolment through to Grade 9. The great majority of those who enter the system progress through to the end of the general education phase. Grade 9 enrolments have been converging with those in Grade 1 in a pattern typical of high enrolment countries. There is however evidence that although the enrolment rates are high they continue to include substantial numbers of overage children.
Enrolments by Year and Grade; Sub Saharan Africa
Uganda
Tanzania
Malawi
Ghana
Kenya
Zambia
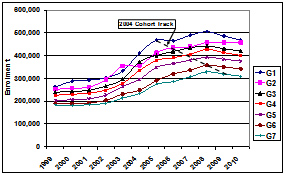
Ethiopia
South Africa