Changing Patterns of Enrolment by Grade and Year
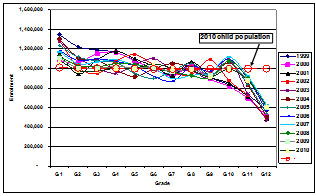
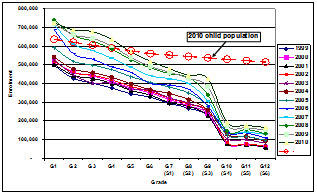
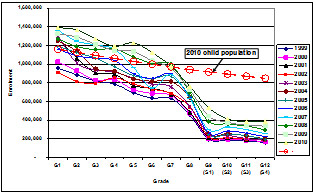
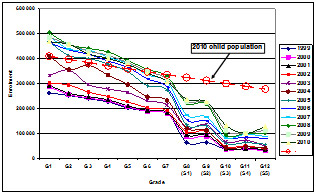
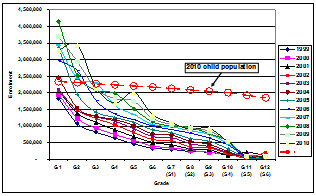
A different way of presenting the same data provides more insight. The same eight countries are shown below but this time showing all grades up to Grade 12 over the last ten years only. In addition a line is drawn on each chart which indicates the size of the age group in 2010 for each grade. As a rough proxy if there was full enrolment and no drop out then the enrolment lines would follow the child population line with about the same gradient.
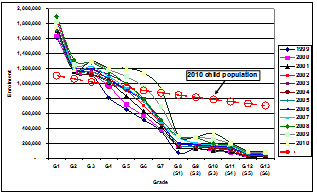
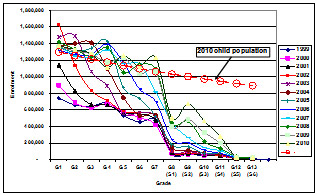
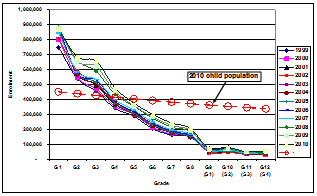
It is very clear from these charts that in all the countries except South Africa there are more children enrolled in Grade 1 than there are in the population of children by age in 2010. The tip over points (where the number enrolled becomes less than those in the relevant child population) vary from Grade 3 (Ethiopia), Grade 5 (Uganda, Malawi, Ghana), Grade 7 (Tanzania and Zambia), and Grade 10 in South Africa. It is important to note that the difference between those enrolled and those in the age group is a proxy for the proportion of children benefiting from a basic education at each grade level. Because those enrolled include those repeating this sets an upper limit to the likely participation rate at any grade level. From these profiles it is very clear that drop out remains a serious problem despite the fact that all these countries have Gross Enrolment Rates over 100%.
Examination of the charts draws attention to other features. In Uganda the bulges in enrolments in 2008/9 and 10 in the later primary Grades are indicative of new efforts to reduce drop out and increase completions rates. Despite moves towards tuition free secondary schooling participation remains well below the nominal numbers in each age group at all secondary level grades.
In Malawi it is clear that drop out has remained very high with those in Grade 8 representing only about half of the number of 14 year olds. Very small numbers enrol at secondary level in Grade 9 and above. There is further drop out after Grade 10 at the transition tom upper secondary. In Kenya enrolments remain high through to Grade 7 and then fall steeply to Grade 8 as a result of queuing - children are held back from Grade 8 if they are likely to fail the KCPE. The numbers in Grade 9, the first year of secondary are only about 50% of those in Grade 8, and are about 50% of the size of the age group. Since many are overage less than half of Kenyan children are likely to be entering secondary school.
In Ethiopia attrition appears very high in the first three years. It is likely that this fall in enrolments over estimates drop out since many in the first three grades are overage and may be repeating and some may be under age. Above Grade 3 fewer are enrolled than there are children in the nominal age group.
In Tanzania it is clear from the administrative data that since 2002 those who have entered Grade 1 have largely remained enrolled. The shape of the enrolment curve has been transformed and a much higher level of equilibrium has been established. This appears to track the nominal number of children in the age range. The effects of abolishing fees at secondary level in government schools are evident in increased enrolments in Grade 8 and above. These remain far from universal levels but may approach those in neighbouring Kenya if current trends are maintained.
In Ghana there has been an increase in enrolments through to Grade 9 every year for the last decade. There has been little change in the rate of drop out between grades. The gains in enrolment in Grade 1 in 2005 reflect the introduction of a capitation system that was coupled with tuition fee abolition. Since then other factors have encouraged growth to continue. Transition to Senor Secondary School (SSS) remains available to a minority who are less than a third of the age group. Zambia has made considerable progress in increasing the entry to Grade 1. As in Ghana the rate of attrition has not fallen and may have increased. Grades 8 and 9 have been incorporated into the first cycle of the basic school system and this is reflected in increased enrolments.
In South Africa the numbers enrolled in Grade 1 are similar to those in Grade 9. They are also comparable to the number in the nominal age group for each grade. There are different estimates of how many of those enrolled are overage, and how many are out of school. It seems probable that 3% - 5% remain unenrolled and between 10% and 20% are overage in Grades 1 to 9.
Enrolments by Grade and Year in Sub Saharan Africa
Uganda
Tanzania
Malawi
Ghana
Kenya
Zambia
Ethiopia
South Africa