Changing patterns of access
Research on changing patterns of access has been used to analyse large scale cross national data sets to understand the evolution of participation, why universalising access has proved so elusive, and what lessons can be learned from the last thirty years (Lewin, 2011; 2009; 2007a, b; Somerset, 2007; Little 2010a, b, c; Rolleston, 2009a, b; Lewin and Sabates, 2010; Oketch and Somerset, 2011; Chimombo, 2009; and Akyeampong, 2009). CREATE research using national samples from thirteen sub-Saharan African countries from the 1990s and 2000s allows comparisons of enrolments over time (Lewin and Sabates 2011). This analysis shows that though overall participation has increased, the chances of the children from the poorest households enrolling and progressing through school relative to the richest households have generally not improved substantially. In some case they have deteriorated. Poorer children are more likely to be overage and unlikely to complete schooling especially if they are girls. Girls are more likely to be out of school than boys in most of the Francophone countries but not in most of the Anglophone countries. Rural children remain more likely to be overage. Reductions in the number of children out of school have occurred but this has often been accompanied by an increase in the proportion of children overage for the grade in which they are enrolled. This was not anticipated and is almost certainly deleterious to efforts to universalize access through to successful completion of the basic education cycle.
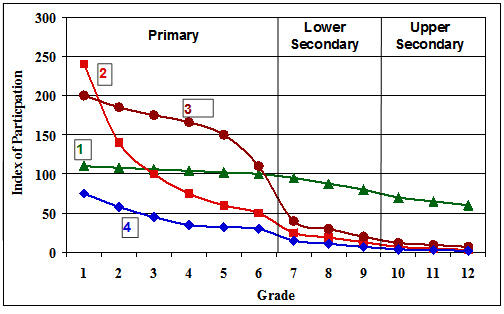
Patterns of enrolment by grade fall into several different categories. A simplified typology is shown below.
Typology of enrolment patterns in school systems
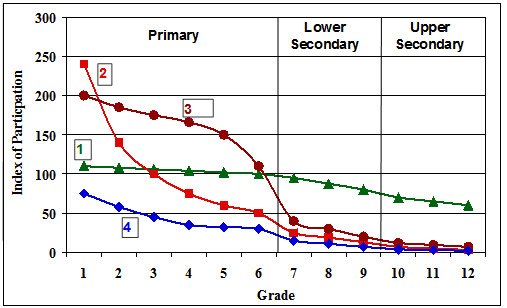
In Type 1 the grade specific participation rate – the number enrolled over the number in the nominal age group for the grade - is a little over 100% in Grade 1 and falls slowly. Secondary level participation also has grade specific enrolment rates close to 100%. These countries mostly have virtually full enrolment and include South Africa, Namibia, Botswana, Mauritius, Sri Lanka and China. In some cases where there are substantial numbers of over age children in the system, grade specific enrolment rates can be around 100% for each primary grade but significant numbers may remain out of school, especially at higher grade levels e.g. South Africa.
In contrast, countries with enrolments like Type 2 have as many as twice the number of children enrolled in Grade 1 as there are in the population. Many are over age and a few are under age. Attrition is sharp and leads to the participation rate falling along a convex curve to around 50% by Grade 6 and continuing to fall in higher grades so secondary participation is low. Many countries with high growth in enrolments after the announcement of universal primary education (UPE) have experienced patterns of enrolment similar to Type 2 with very high grade specific enrolment rates in Grade 1. These countries include Malawi, Uganda, Kenya.
The third group of countries, Type 3, are similar except that the decline in enrolments through the primary grades follows a concave curve suggesting that retention in the early grades is high but that drop out becomes increasingly rapid in higher grades as in Ghana and Zambia.
Type 4 countries have very low enrolment rates at all levels. In these countries many do not enter Grade 1 and most fail to reach Grade 6. Many of these countries are in francophone Africa. Patterns of enrolment in Indian states follow the same general typology (Lewin, 2011b). It is a reasonable assumption that the investments targeted at universal primary enrolment should result in Type 4 countries evolving through Types 3 and 2 to Type 1. The evidence is that at least in some cases patterns 2, 3 and 4 persist without evolving as quickly as policy often presumes will be the case (Lewin, 2009; Lewin and Sabates, 2011).
The conclusion is that big pushes to increase enrolments are often difficult to sustain. Their effects tend to be greatest in the lowest grades, and are often transient. Several years later growth reflects longer term trends related to demography and to growth in the economy and in infrastructure that enhances access to education. Increased participation overall, with little improvement in drop out rates and slow increases in successful completion, has been more common than was anticipated over the last two decades. Policy can accelerate development but needs to be developed in the light of realistic patterns of progress.
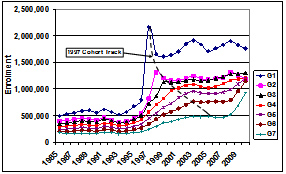
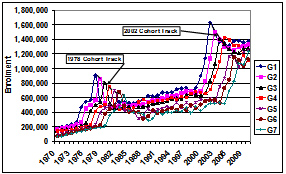
Patterns or participation can be explored in many different ways. Here we present insights based on enrolments by year and grade to show the impact of policy initiatives to universalise access to primary education; enrolments by grade and year to highlight patterns of attrition; enrolments by grade and gender parity to indicate disparities; enrolments by age and grade to highlight the numbers of over age children in school, and enrolments by household income and grade to illustrate inequalities.
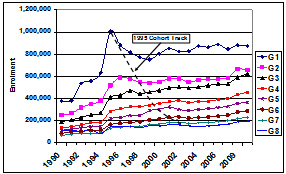
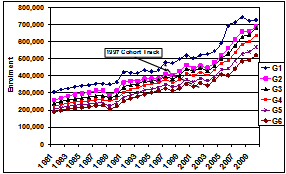
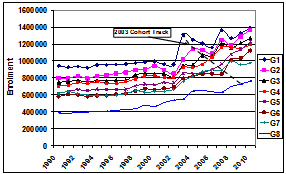
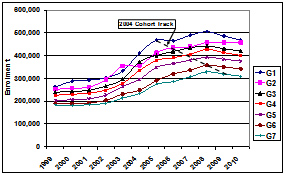
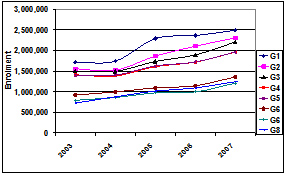
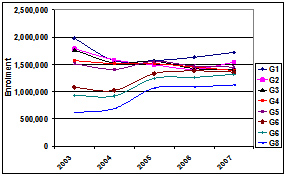
Enrolments by Year
Enrolments over time; Sub Saharan Africa and India
Uganda
Tanzania
Malawi
Ghana
Kenya
Zambia
Madhya Pradesh
Andhra Pradesh
Patterns of Enrolment by Grade
Patterns of enrolment by grade fall into several different categories. A simplified typology is shown. In Type 1 the grade specific participation rate – the number enrolled over the number in the nominal age group for the grade - is a little over 100% in Grade 1 and falls slowly. Secondary level participation also has grade specific enrolment rates close to 100%. These countries mostly have virtually full enrolment and include South Africa, Namibia, Botswana, Mauritius, Sri Lanka and China. In some cases where there are substantial numbers of over age children in the system, grade specific enrolment rates can be around 100% for each primary grade but significant numbers may remain out of school, especially at higher grade levels e.g. South Africa.
In contrast, countries with enrolments like Type 2 have as many as twice the number of children enrolled in Grade 1 as there are in the population. Many are over age and a few are under age. Attrition is sharp and leads to the participation rate falling along a convex curve to around 50% by Grade 6 and continuing to fall in higher grades so secondary participation is low. Many countries with high growth in enrolments after the announcement of universal primary education (UPE) have experienced patterns of enrolment similar to Type 2 with very high grade specific enrolment rates in Grade 1. These countries include Malawi, Uganda, Kenya.
The third group of countries, Type 3, are similar except that the decline in enrolments through the primary grades follows a concave curve suggesting that retention in the early grades is high but that drop out becomes increasingly rapid in higher grades as in Ghana and Zambia.
Type 4 countries have very low enrolment rates at all levels. In these countries many do not enter Grade 1 and most fail to reach Grade 6. Many of these countries are in francophone Africa. Patterns of enrolment in Indian states follow the same general typology (Lewin, 2011b). It is a reasonable assumption that the investments targeted at universal primary enrolment should result in Type 4 countries evolving through Types 3 and 2 to Type 1. The evidence is that at least in some cases patterns 2, 3 and 4 persist without evolving as quickly as policy often presumes will be the case (Lewin, 2009; Lewin and Sabates, 2011).
The conclusion is that big pushes to increase enrolments are often difficult to sustain. Their effects tend to be greatest in the lowest grades, and are often transient. Several years later growth reflects longer term trends related to demography and to growth in the economy and in infrastructure that enhances access to education. Increased participation overall, with little improvement in drop out rates and slow increases in successful completion, has been more common than was anticipated over the last two decades. Policy can accelerate development but needs to be developed in the light of realistic patterns of progress.
Typology of enrolment patterns in school systems